Some exploration with perf_events, the performance counters subsystem in Linux, and FlameGraph, the code path profile visualization tool by Brendan Gregg.
The problem
I was trying to explain horrible scaling when running multiple independent tinker molecular modeling processes in parallel. Run alone, a micro-benchmark took under a second; run in parallel, weak scaling efficiency was roughly ~20% — this while well under the host’s core count and memory capacity, where I’d expect something closer to 100% efficiency. Furthermore, it was only a problem on a certain architecture — Intel Nehalem/Westmere, but not Harpertown or AMD Abu Dhabi.
Initial look — high sys cpu, but what?
I took a basic first peek at what’s going on, using top and other procps utils.
All processes were at ~100% cpu for the duration, and it was all sys cpu.
So next I took a look at the syscalls, using strace.
Running through stracestats, syscalls were only a tiny fraction of the wall time, and represented a constant time for each proc, independent of parallelism.
So not the issue.
Then what’s all that sys cpu doing?
Perf to the rescue
This was my first time digging deep into perf, i.e. beyond perf top.
It’s amazing — wow should I have added this to my toolbelt sooner.
So comprehensive — for profiling, it’s a sun compared to the strace, gdb, etc. lamplights.
I actually went down this route because of the highly-communicative flamegraph plots I’d seen circulating. Flamegraph makes perf even more fun. So I’m following in the footsteps of Brendan Gregg — he wrote flamegraph, wrote the best intro to perf I know of, and has since followed up with a hot talk at LinuxCon.
Back to the problem at hand — the program runs fine solo, and super slow in parallel; what’s the difference? Perf gave the answer, and flamegraph made it easy to see; here’s how:
Run perf (as root) to start profiling the whole system:
1
| |
Run the problematic code, analyze (as me), then kill the perf.
Clone flamegraph and put it in the PATH.
Generate a flamegraph from the perf output (grepping out only the “analyze” lines that I are relevant):
1 2 | |
The results for running solo and for running four in parallel are below. Horizontal widths are time spent in each call (not a time series); going up vertically is going deeper into the call stack. Widths are normalized to total run time (the solo plot represents just under a second; the parallel one 18 seconds).
Aha, page faults!
Memory management.
Specifically during the initprm_ function call.
There is a huge stack of page_fault on top of initprm_ (and kvdw_) in the parallel case compared to the solo case.
Okay, so simple /usr/bin/time had actually already pointed out the huge minor page_fault counts in the parallel case, but this better communicates the story, and it’s only the beginning…
Finding the responsible source code
Make sure analyze is compiled w/ -ggdb and -fno-omit-frame-pointer, and turn down optimization, too (-O0) so things don’t get confusing.
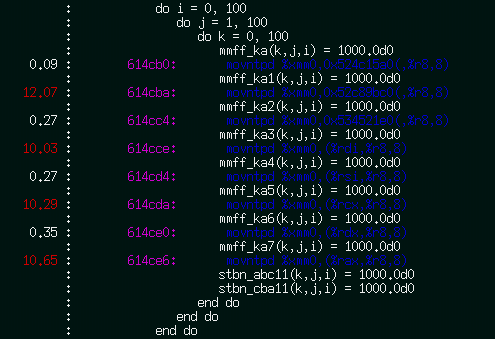
Then perf can combine the recorded profile and the program’s source:
1
| |
 …
…
 …
…
That left-hand column is % cpu time for each line of source code, and the corresponding assembly!
There were two similar loops later in the output, too.
So the issue is initialization of a bunch of 3D double-precision matrices in initprm.f.
Fixing the problem?
Here’s where the story unravels, unfortunately.
The dimension traversal looks good (Fortran uses column-major order)… but maybe it’s a problem jumping from each 8MB matrix to the next? Nope, re-ordering and initializing each separately didn’t get rid of the page faults, only moved them.
Given the slowdown only happened on older Nehalem/Westmere nodes with three memory channels, and the slowdown kicked in particularly bad when running four or more in parallel, that probably has something to do with it…
Or maybe there’s just something about memory that this already shows and I don’t understand (anyone?).
But in the meantime, the hosts that demonstrated the problem have been upgraded (distro point release and 2.6.32-358.11.1 –> 2.6.32-431.17.1 kernel upgrade), and the problem has gone away!
Since the need to actually solve this has dried up, it remains an unsolved mystery.
Summary
Perf is awesome, and flamegraphs make it even more fun. I quickly went from a black box of sys cpu usage, to lines of source code responsible for it. Though this example problem disappeared before I finished a complete analysis, perf was spot-on showing where to look. The exploration was worthwhile, and this is exactly where I’ll pick up next time I hit such a situation.

